Figure 4.

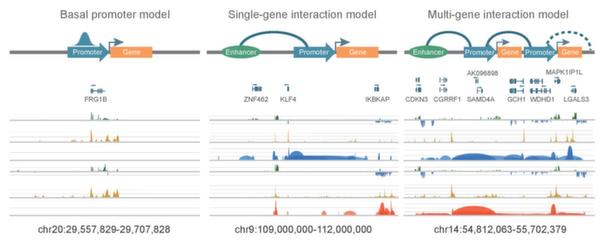
Transcription models based on chromatin interactions. Left to right: basal promoter model, single-gene interaction model and multi-gene interaction model. This figure is from Li et al., 2012 [11]

Transcription models based on chromatin interactions. Left to right: basal promoter model, single-gene interaction model and multi-gene interaction model. This figure is from Li et al., 2012 [11]