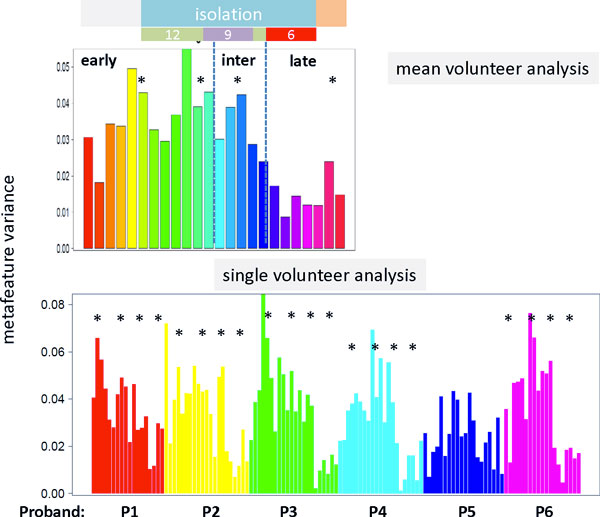
Figure 9.

Total level of protein abundance averaged over all probands (part above) and separately for each proband (part below) as a function of time: We calculated the variance of the meta-feature abundance landscapes obtained after SOM training using not-centralized protein abundance profiles. The oordinate values thus estimate the mean squared amplitude of overall abundance as a function of time. The asterisks indicate the sequence of four peaks observed virtually in all data sets.
