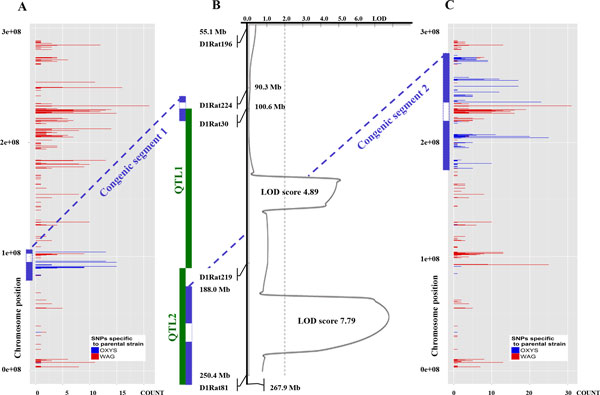
Figure 1.

The distribution of SNPs specific to the parental strains, on chromosome 1 of the congenic rats: WAG/OXYS-1.1 (panel A) and WAG/OXYS-1.2 (panel C). Panel B shows a plot of distribution of retinopathy linkage probability (LOD score) among the F2 progeny derived from OXYS and WAG strains at age 3 months (using microsatellite markers on chromosome 1). The dotted vertical line at LOD = 2.0 is the threshold for suggestive statistical significance. Red bars correspond to individual SNPs, specific to WAG rats, blue - to OXYS rats. COUNT - a number of coding SNPs for 1 Mbp. The OXYS-derived loci of chromosome 1 transferred to the recipient WAG genome during the construction of the corresponding congenic strains are shown as green (expected) and blue (the congenic segment) inserts, to the left of the linkage map. The blue dotted lines are designed to compare the certain congenic loci between the panels. Note, that the transferred locus was not what we expected in WAG/OXYS-1.1 rats.
