
Figure 8.
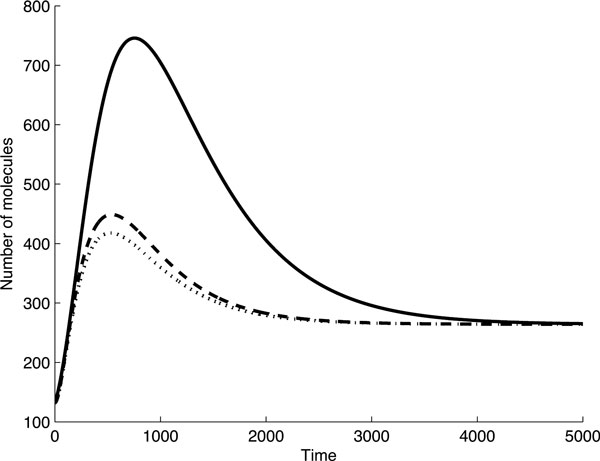
The target protein profiles in 1C FFL are shown in different models for identical both initial conditions and the steady state level of a target protein. Solid line - Stop model, dashed line-Target degradation model, dotted line - Dual degradation model.