Figure 5.
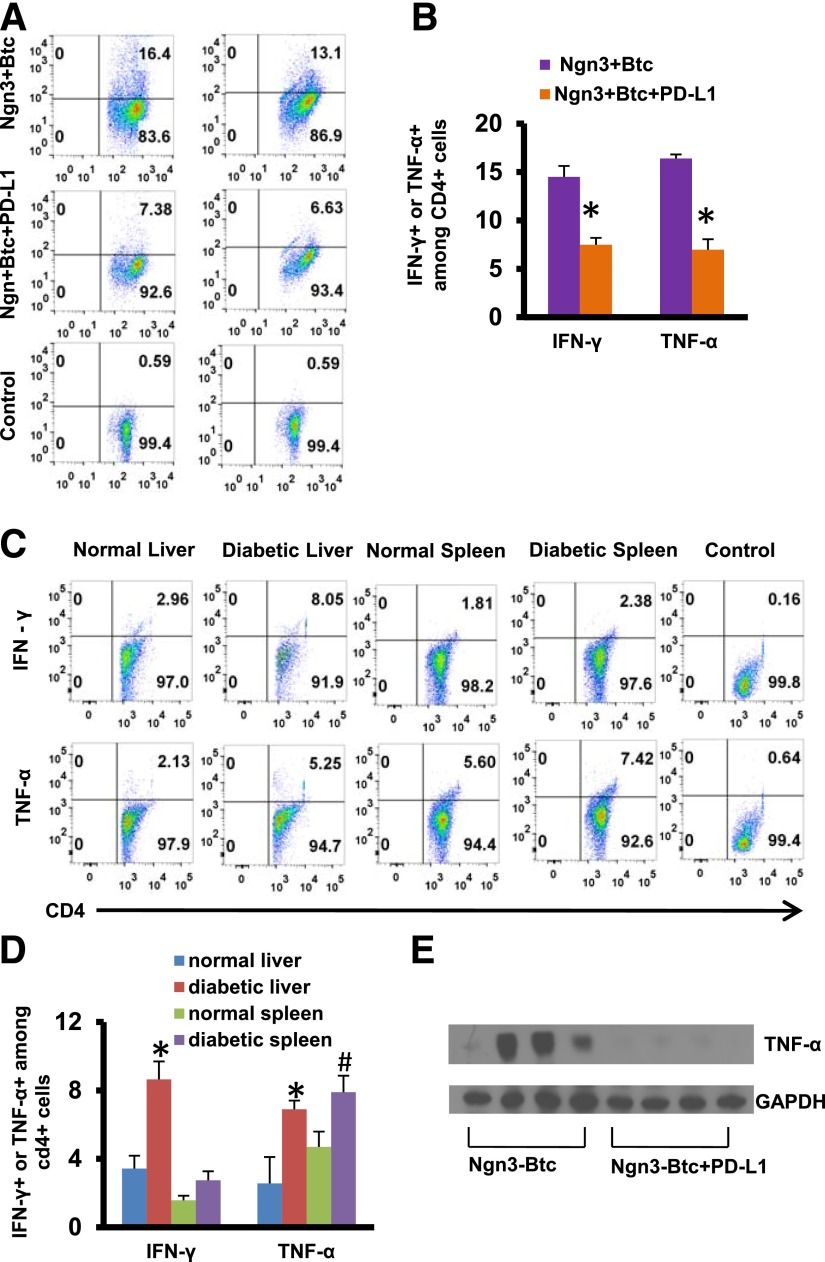
PD-L1 protects neo-islets by inactivating T cells. A and B: IFN-γ– and TNF-α–positive CD4+ T cells isolated from livers of treated mice after ex vivo stimulation with anti-CD3 and anti-CD28 on FACS analysis. Representative dot plot from one set of mice is shown in A, and quantification from three to five separate mice is shown in B. C and D: IFN-γ– and TNF-α–positive CD4+ T cells isolated from liver or spleen of nondiabetic or diabetic mice after ex vivo stimulation with anti-CD3 and anti-CD28 on FACS analysis. Representative dot plot from one set of mice is shown in C, and quantification from three to four separate mice is shown in D. Control shown is unstimulated CD4+ T cells from the spleen of Ngn3-Btc–treated (A) or untreated diabetic (C) mice. E: Western blotting of whole-liver lysate for TNF-α at 8 weeks after treatment. Data are mean ± SEM. *P ≤ 0.05; #P ≤ 0.06.

