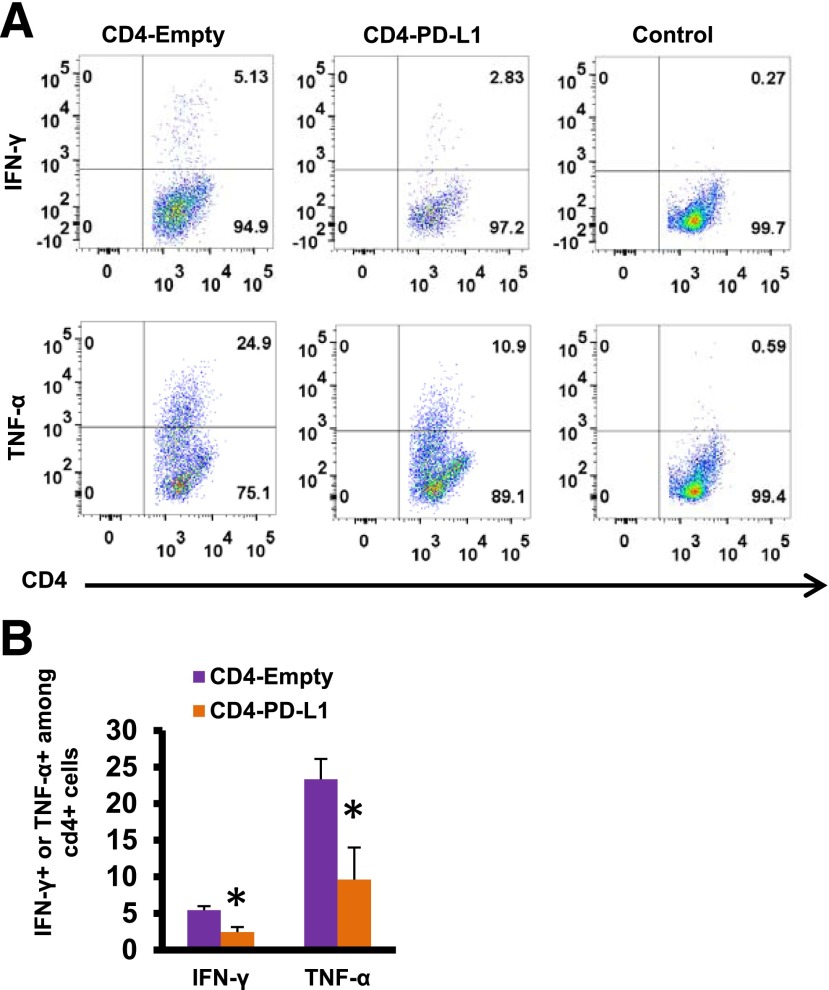
Figure 6.
IFN-γ and TNF-α protein was assessed in isolated CD4+ T cells purified from the spleen of nondiabetic NOD mice that were first stimulated with anti-CD3 and anti-CD28 for 2 days and then coincubated with HDAd-empty or HDAd-PD-L1 virus-infected β-cells (rat insulinoma cell line INS-2 cells) for 24 h. Representative dot plot of one set of experiments is shown in A and B. Data are mean ± SEM. *P ≤ 0.05. CD4-empty, stimulated CD4+ cells coincubated with β-cells infected with HDAd-empty; CD4-PD-L1, stimulated CD4+ cells coincubated with β-cells infected with HDAd-empty PD-L1; control, unstimulated CD4+ cells.

