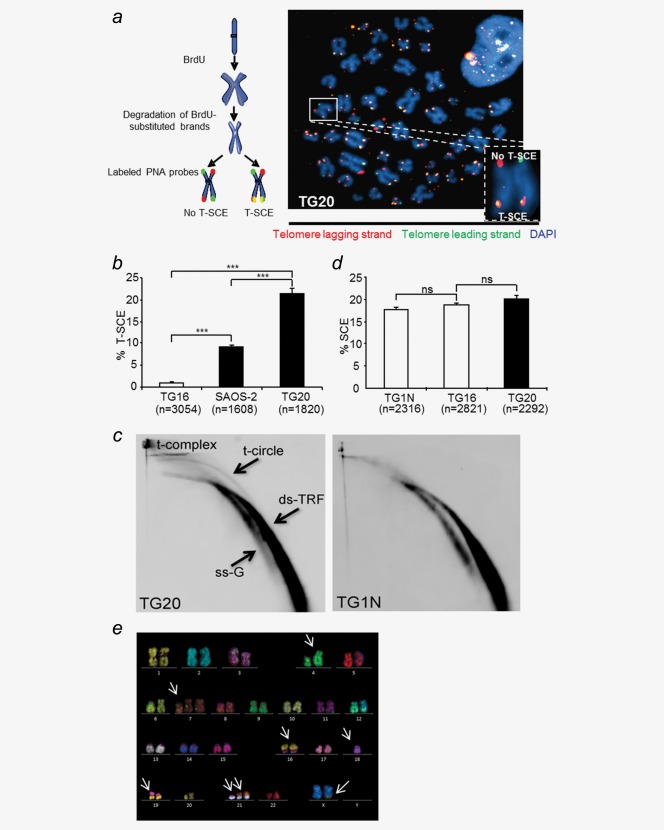
Figure 1.
TG20 cells exhibit a high level of telomeric recombination. (a) The chromosome oriented (CO)-FISH procedure was used for T-SCE analysis. Successive hybridizations with FITC or Cy3-labeled PNA probes allowed detection of the parental telomere C and G strands, respectively. Telomere lagging strands are stained in red, telomeric leading strands are stained in green, and yellow-stained telomeres are scored as T-SCEs. The representative metaphase image on the right is an example from the TG20 ALT cell line. The inset shows a chromosome with extremities with or without T-SCE. (b) T-SCE results of the depicted cell lines. Values are presented as T-SCE events per 100 chromosome extremities, and “n” indicates the number of chromosome extremities counted (***p < 0.001, Student's t-test). (c) 2D gel electrophoresis and analysis of telomeric DNA after hybridization with a telomeric C-rich probe in TG1N and TG20 GSCs. ds-TRF, double-stranded telomeric restriction fragments; ss-G, linear single-G-strand telomeric DNA. (d) SCE analysis on TG1N and TG16 telomerase-positive cell lines and the TG20 ALT cell line. Values are presented as SCE events per 100 chromosomes, and “n” indicates the number of analyzed chromosomes (ns = non-significant, p > 0.05, Student's t-test). (e) Representative M-FISH results from late-passage TG20 cells. Arrows indicate the anomalies.

