Figure 4.

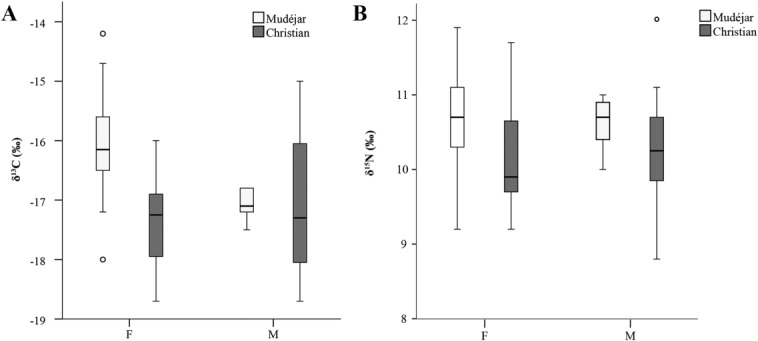
Boxplot comparison between δ13C (A) and δ15N (B) values and sex within the mudéjar and Christian populations. Error bars denote 95% confidence interval, circles indicate outliers.

Boxplot comparison between δ13C (A) and δ15N (B) values and sex within the mudéjar and Christian populations. Error bars denote 95% confidence interval, circles indicate outliers.