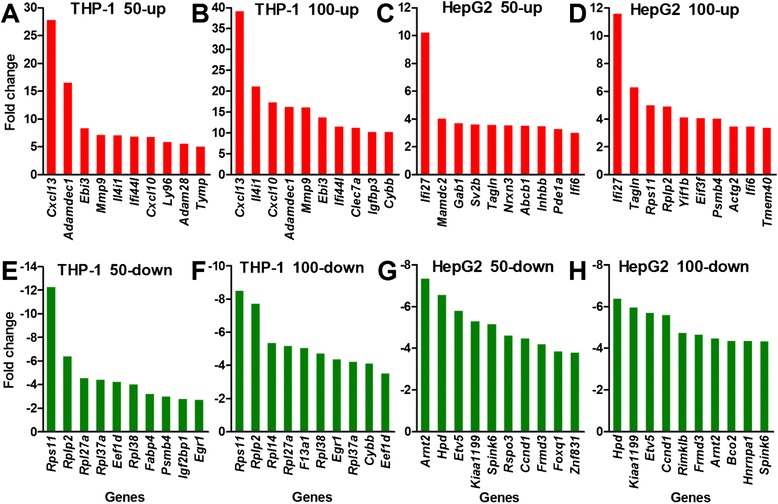
Figure 3.

The top 10 genes with the highest expression changes in the two cell types after treatment with FeNPs. A and B: Induced genes in the THP-1 cells. C and D: Induced genes in the HepG2 cells. E and F: Repressed genes in the THP-1 cells. G and H: Repressed genes in the HepG2 cells. 50-up and 100-up: induced genes in cells treated with 50 μg/mL and 100 μg/mL of FeNPs, respectively; 50-down and 100-down: repressed genes in cells treated with 50 μg/mL and 100 μg/mL of FeNPs, respectively. Some uncharacterized genes with fold changes greater than the lowest fold changes in these plots are not shown in this figure.
