
Figure 4.
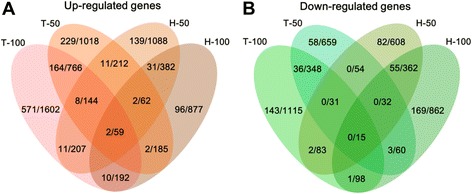
Comparison of FeRGs in the THP-1 and HepG2 cells. A: Comparison of induced genes in the two cell lines. B: Comparison of repressed genes in the two cell lines. Each Venn diagram is divided into four areas labeled as T-50, T-100, H-50 and H-100. T-50 and T-100, THP-1 treated with 50 μg/mL and 100 μg/mL of FeNPs, respectively. H-50 and H-100, HepG2 cells treated with 50 μg/mL and 100 μg/mL of FeNPs, respectively. The number in overlapped area represents the overlapping genes. The numbers before and after the slash represent the genes with fold changes greater than 2 and 1.5, respectively.