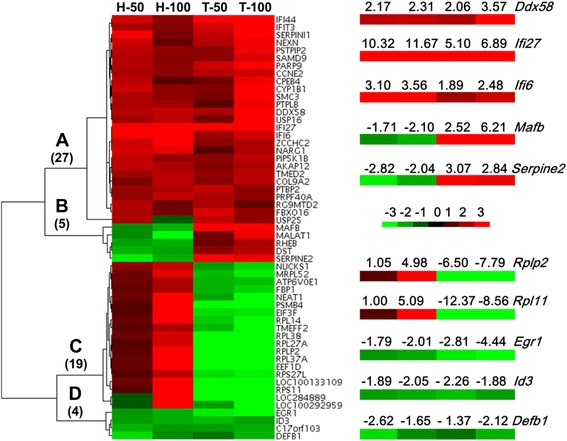
Figure 6.

Cluster analysis of genes. Fifty-five FeRGs from the two cell lines were clustered according to their expression levels using a hierarchical clustering. The heatmap was drawn with Java TreeView. Red and green represent up- and down-regulation, respectively. The color depth reflects the expression level between −3 and +3 (marker). The numbers of genes in Clusters A to D are shown in parentheses. The fold changes of 10 representative genes in four clusters are shown in the zoomed images. T-50, H-50, T-100, and H-100, see Figure 4.
