Figure 9.

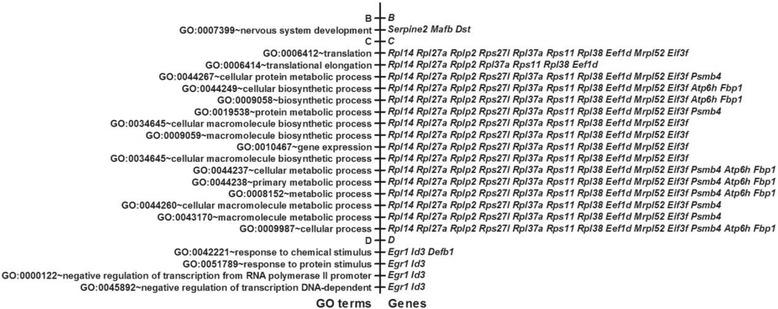
GO analysis of the FeRGs with different expression patterns. B, C and D, genes in Clusters B, C and D (Figure 6), and their associated GO terms. The p values for all GO terms are less than 0.05. An alias of Atp6h is Atp6v0e1.

GO analysis of the FeRGs with different expression patterns. B, C and D, genes in Clusters B, C and D (Figure 6), and their associated GO terms. The p values for all GO terms are less than 0.05. An alias of Atp6h is Atp6v0e1.