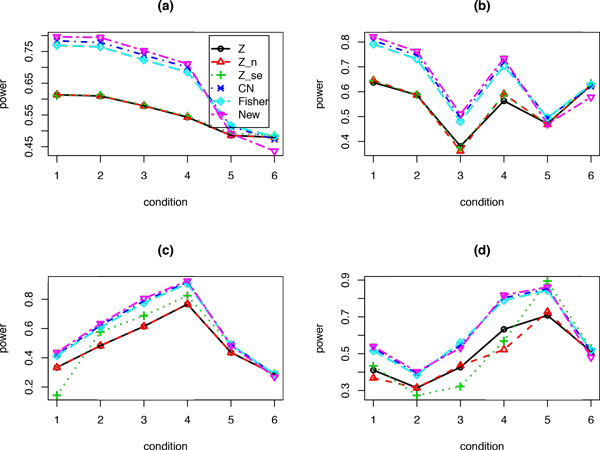
Figure 1.

Power values for each method under six different conditions: the total effect size is 1 and the ratios of the K = 2 effect sizes between study 1 and study 2 are 0, 0.01, 0.05, 0.1, 0.5, and 1. (a) Sample sizes n = 20, and standard deviation σ = 1 for each study; (b) Same as (a), but the sample size n is a random sample from Poi(20); (c) Same as (a), but the standard deviation σ is a random sample from gamma(10, 0.1); (d) Same as (b), but the standard deviations σ is a random sample from gamma(10, 0.1).
