
Figure 2.
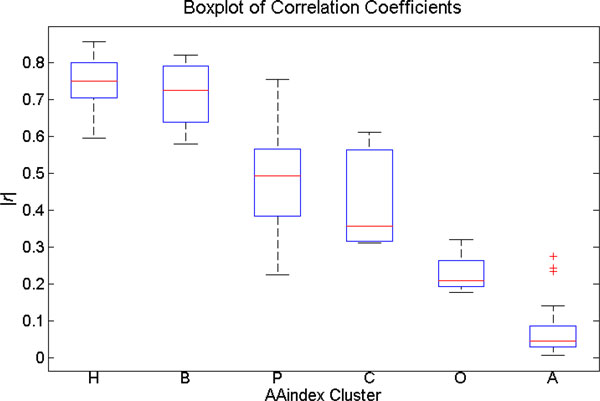
Correlation coefficients between IDP-Hydropathy and AAindex clusters. H: Hydrophobicity cluster B: β propensity cluster P: Physicochemical properties cluster C: Composition cluster O: Other properties cluster A: α and turn propensities
Official websites use .gov
A
.gov website belongs to an official
government organization in the United States.
Secure .gov websites use HTTPS
A lock (
) or https:// means you've safely
connected to the .gov website. Share sensitive
information only on official, secure websites.
Correlation coefficients between IDP-Hydropathy and AAindex clusters. H: Hydrophobicity cluster B: β propensity cluster P: Physicochemical properties cluster C: Composition cluster O: Other properties cluster A: α and turn propensities