
Figure 1.
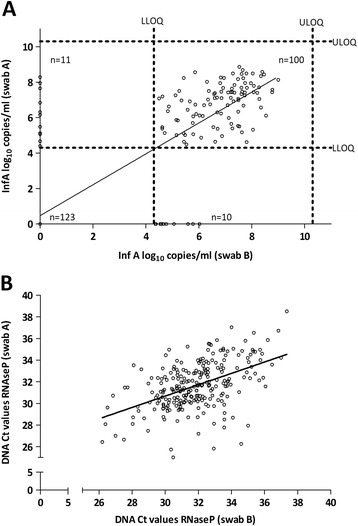
Variability plot of influenza A viral load or RnaseP DNA as observed for two mid-turbinate swabs taken from the same patient (n = 244). A: Influenza A viral load (r2=0.733): One hundred samples have an InfA VL > LLOQ for both swabs (r2 = 0.183). Dotted lines represent upper limit of quantification (ULOQ) = 10.3 log10 copies/ml & lower limit of quantification (LLOQ) = 4.3 log10 copies/ml. Viral load values below LLOQ are plotted in the respective axes or on the origin. B: RnaseP DNA (r2 = 0.242).