
Figure 6.
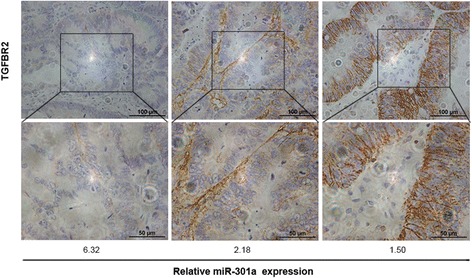
Immunohistochemical staining of TGFBR2 in CRCs. Higher expression of TGFBR2 was observed mainly in CRCs with low miR-301a level (r = -0.72, P < 0.001). Magnification, ×200. Scale bars, 100 μm.
Official websites use .gov
A
.gov website belongs to an official
government organization in the United States.
Secure .gov websites use HTTPS
A lock (
) or https:// means you've safely
connected to the .gov website. Share sensitive
information only on official, secure websites.
Immunohistochemical staining of TGFBR2 in CRCs. Higher expression of TGFBR2 was observed mainly in CRCs with low miR-301a level (r = -0.72, P < 0.001). Magnification, ×200. Scale bars, 100 μm.