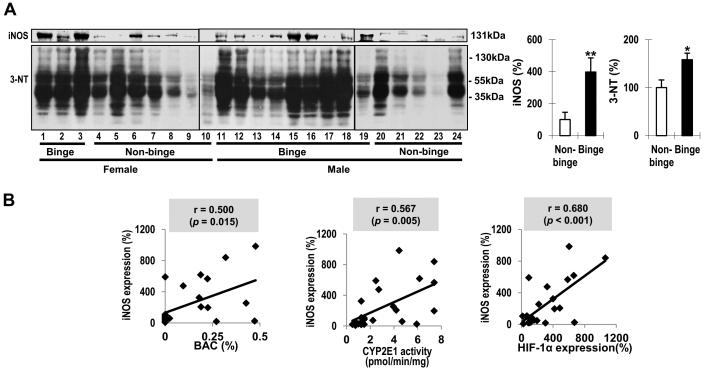
Fig. 6. Effects of binge alcohol on protein nitration in humans.
(A) Immunoblot analyses of iNOS and 3-NT in whole liver lysates and quantitative analysis. Data expressed as means ± SE(*p< 0.05 and **p< 0.01). (B) Correlative analysis between iNOS and BACs, CYP2E1, or HIF-1α. iNOS levels were plotted against: BACs, CYP2E1 activities or HIF-1α. r, Pearson correlation coefficient.

