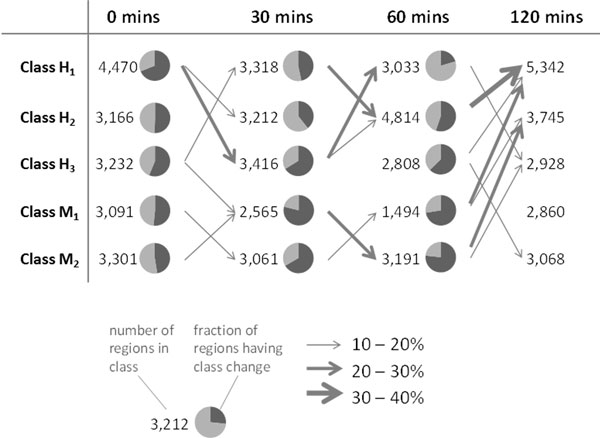
Figure 5.

Dynamics in enhancer classes following LPS stimulation. For five enhancer classes (H1, H2, H3, M1, and M2) class transitions following stimulation are shown, with arrows indicating frequent transitions and the arrow thickness representing the frequency of the transition. Number indicate the number of enhancers belonging to each enhancer class at each time point, and the pie charts represent the fraction of enhancers in each class at each time point making or not making a class transition.
