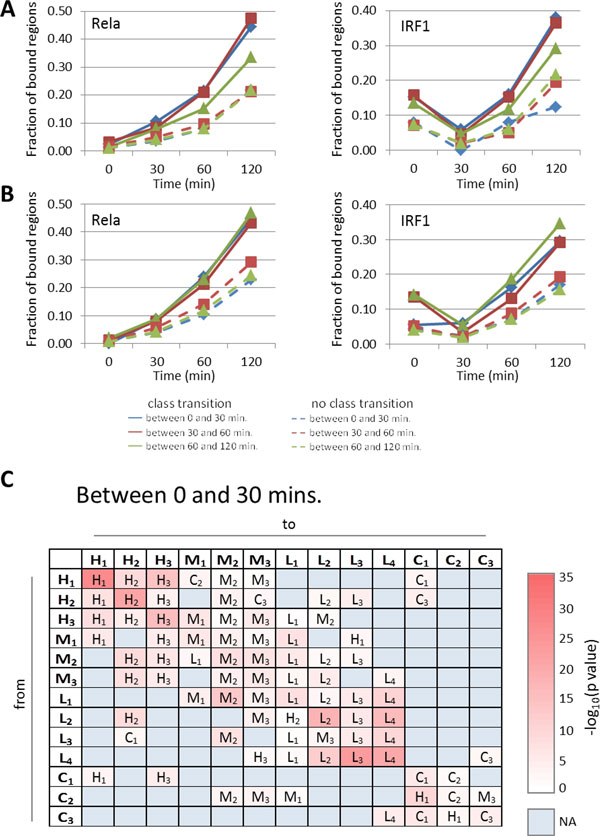
Figure 7.

Role of activated TFs and inter-enhancer interactions in TF binding changes after LPS stimulation. (A) Two plots show the fraction of H3 regions bound by Rela and IRF1, respectively. Solid lines represent H3 regions switching to class H1 before 30 mins. (blue), before 60 mins. (red) and before 120 mins. (green) after stimulation. Dotted lines are for H3 regions not making a change between these time points. (B) Same as in (A) for H2 regions changing (or not changing) to class H1. (C) Table summarizing the positional biases between enhancers changing from one class (rows) to another (columns) between time points 0h and 0.5h. For each pair of classes, the enhancer class located most closely to the changing enhancers is shown. The colour code represents t-test p values. The same tables for time points 0.5h to 1h and 1h to 2h are shown in Supplementary Fig. S6 in Additional file 1.
