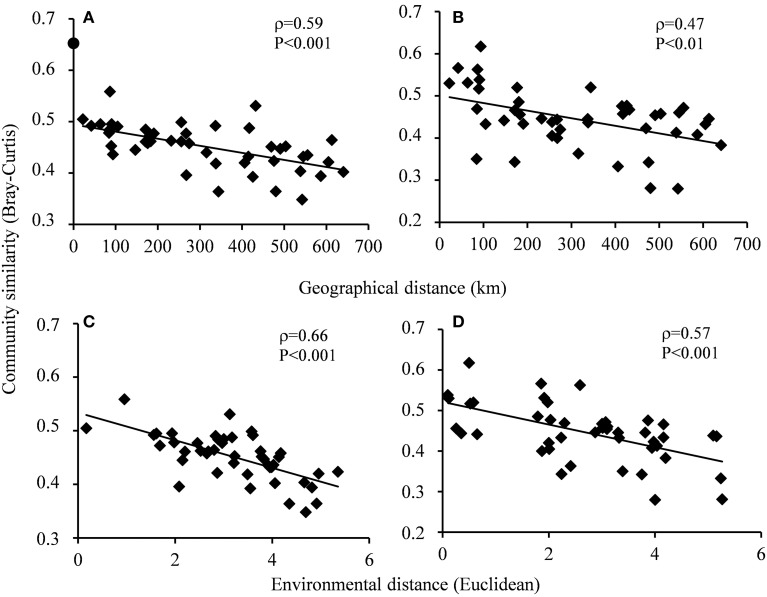
Figure 4.
Relationships between community similarity (1-Bray Curtis index) and spatial distance (A,B) and between community similarity and environmental distance (C,D) for Bacteria (A,C) and Archaea (B,D). The beta-diversity of the two bacterial station 6 datasets (filled circle in A) is not included in the regression line or correlation analyses. The significance of the correlations were assessed by Mantel tests based on Spearman's rank correlation with 104 Monte Carlo permutations.

