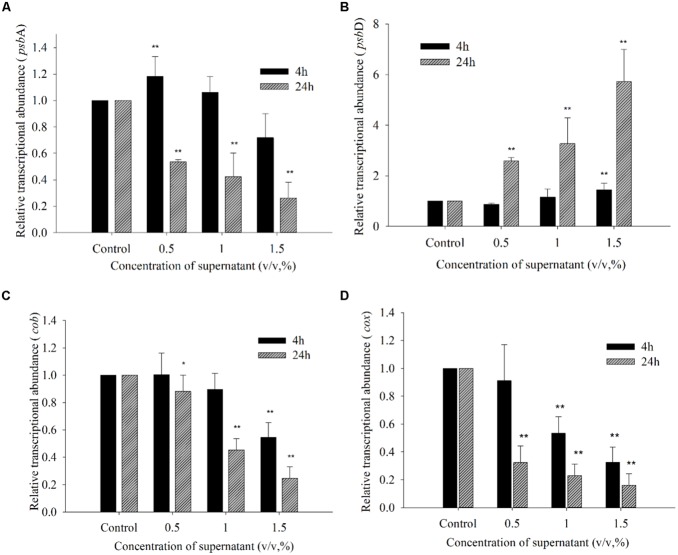
FIGURE 9.
Expression of psbA (A), psbD (B), cob(C), and cox(D) in A. tamarense exposed to different concentrations of BS02 supernatant supernatant for 4 and 24 h. All error bars indicate SE of the three replicates.*represents a statistically significant difference of p < 0.05 when compared to the control, **represents a statistically significant difference of p < 0.01.

