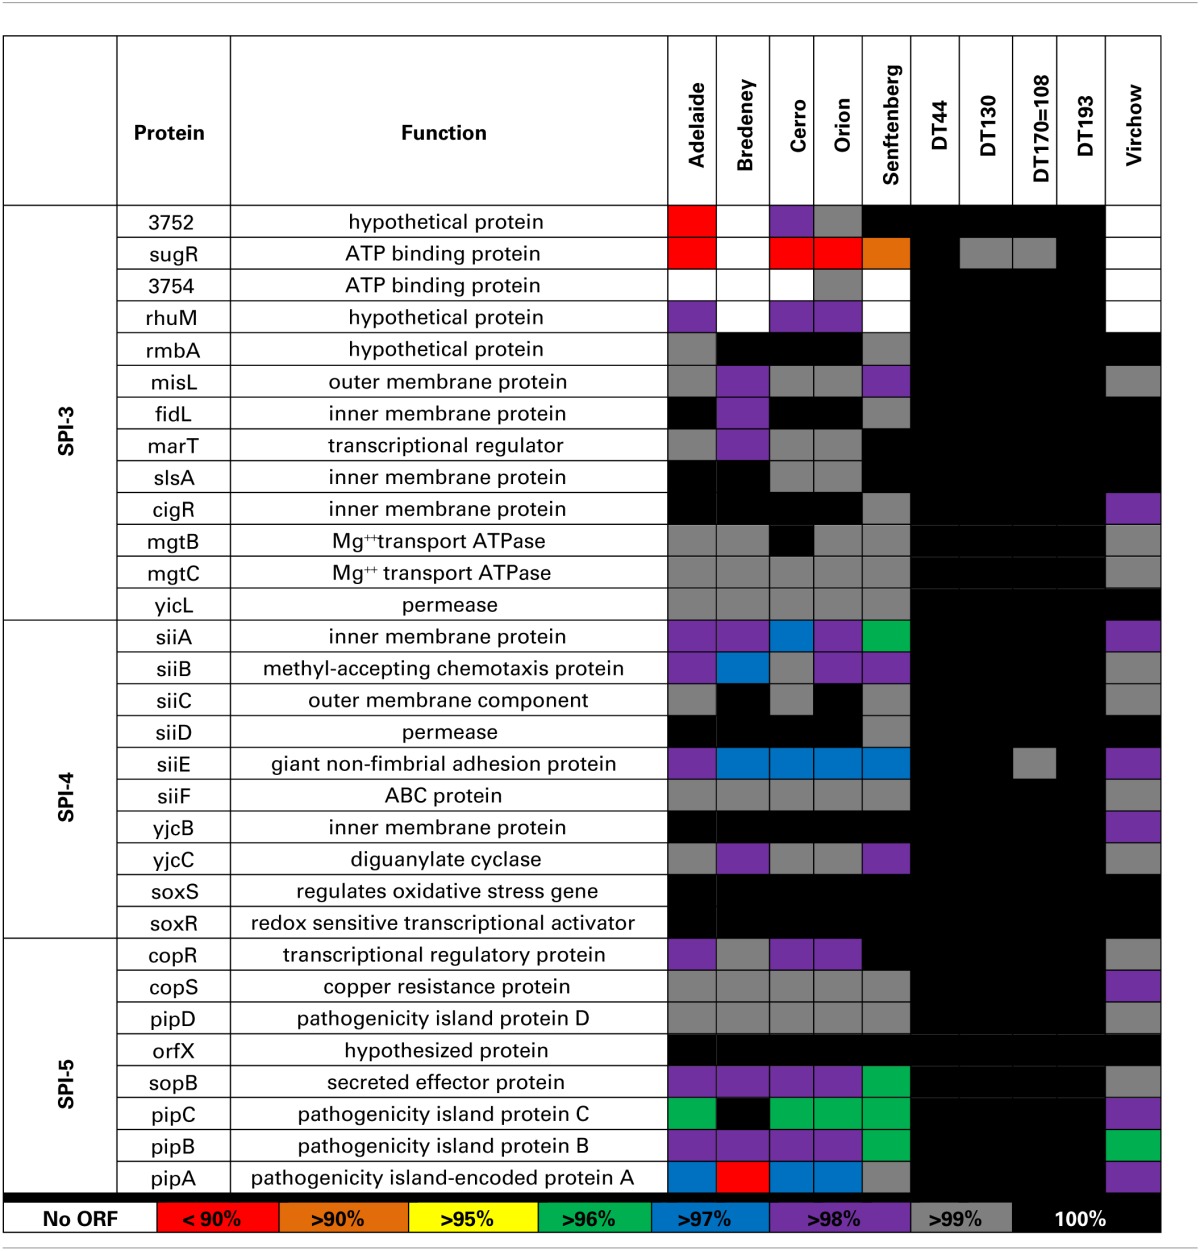
Table 6.
Amino acid variability of SPI-3, -4 and -5.

Genes are color coded according to their amino acid similarity to the reference strain LT2. Sections denoted with white indicate that no open reading frame (ORF) was present. The SPI-3 region between STM3752 and rhuM as well as siiA, B and E in SPI-4 was among the most variable. In SPI-5, the pip operon exhibited the highest level of amino acid variation.
