
Figure 2.
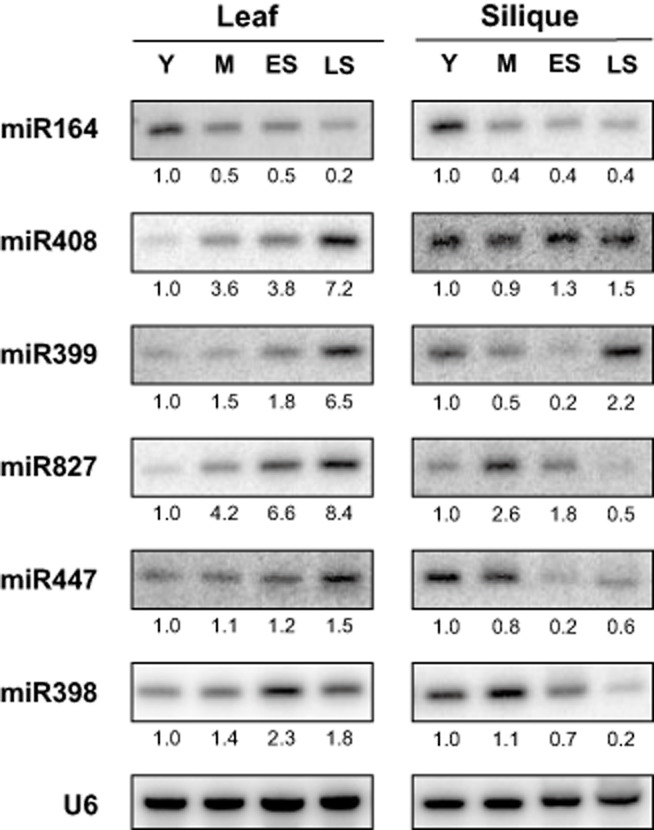
Expression of nutrient-responsive miRNAs in Arabidopsis leaf and silique over the course of senescence and development. miRNA expression level was examined via northern blotting. Stages Y (young), M (mature), ES (early senescence) and LS (late senescence) were selected as described in Fig. 1. U6-normalized quantification values are displayed below each stage. Data are representative of at least two biological replicates; one representative U6 is shown.