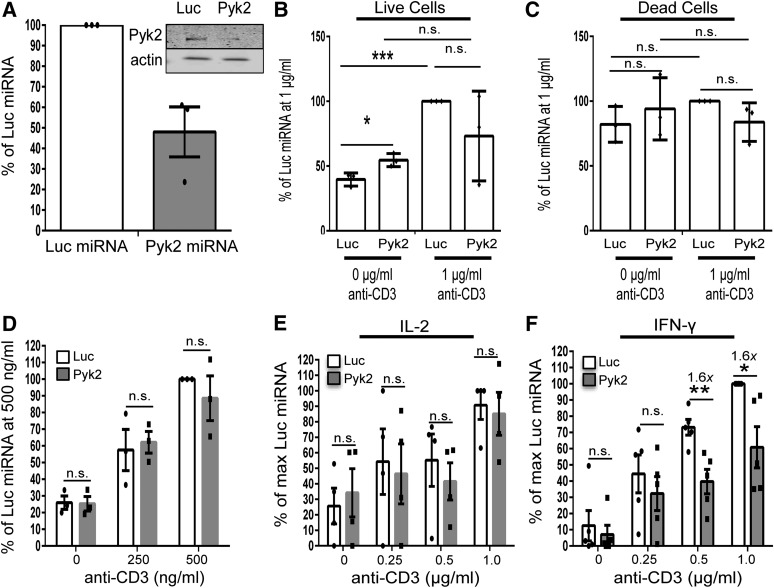
Figure 2. Pyk2 repression inhibits select downstream effector functions upon TCR activation.
(A) Control and Pyk2-deficient CD4 hAPBTs were generated. Pyk2 expression in whole-cell lysates was analyzed by immunoblotting. The relative expression of Pyk2 compared with the actin-loading control was calculated. The graph shows quantified differences in Pyk2 expressions from 3 independent transfections ± sem, with each dot representing the average Pyk2 expression for an individual experiment. (B and C) Control or Pyk2-deficient CD4 hAPBTs were incubated in the presence or absence of 1 μg/ml anti-CD3 for 3 days. Live and dead cells were counted by trypan blue exclusion. (B) Live cell data represented as the fold change over the 0 μg/ml control ± sem, and each dot shows the calculated value for each experimental replicate. (C) Dead cell data represented as the fold change over the 0 μg/ml Luc miRNA control ± sem. Each dot shows an experimental replicate. (F) Control and Pyk2-deficient CD4 hAPBTs were stimulated using various doses of soluble anti-TCR antibodies for 4 h. CD69 surface expression was then assessed by flow cytometry. Data are depicted as the average fold change relative to the 500 ng/ml Luc miRNA sample ± sem, with each of the dots depicting the relative expression obtained from each human donor. *P < 0.05; **P < 0.01; ***P < 0.001.(E and F) Control or Pyk2-deficient CD4 hAPBTs were stimulated by use of various doses of immobilized anti-CD3 for 24 h. IL-2 (E) and IFN-γ (F) production was assessed by ELISA. The data were normalized to percentages of the maximum cytokine secretion of the Luc miRNA cells, and the mean of at least 3 independent experiments ± sem is shown, with each dot representing the data obtained from an individual human donor.

