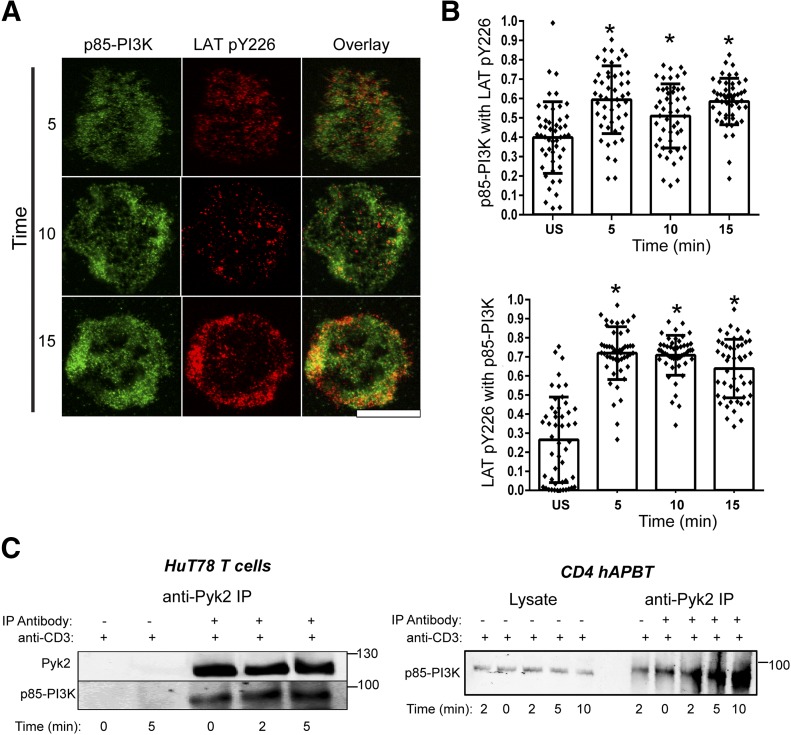
Figure 5. p85-PI3K associates with phosphorylated LAT and Pyk2.
(A) HuT78 T cells stimulated by use of anti-CD3 antibody coated on glass chamber slides for 5, 10, or 15 min. Cells were also stimulated for 5 min and stained by use of the secondary antibodies alone (US). Data are representative of 2 independent experiments. Original scale bar, 5 μm. (B) The Manders correlation coefficients were calculated for 50 cells (25 from each independent experiment). The calculated coefficient for each cell is depicted by the dots, and the average coefficient value ± sd is shown in the bar graph and error bars. *P < 0.005 compared with the negative control. (C) HuT78 T cells (left) and CD4 hAPBTs (right) were stimulated with soluble anti-TCR antibodies for various times and lysed. Pyk2 was immunoprecipitated (IP) from these cells, and its association with p85-PI3K was assessed by immunoblotting. Data are representative of at least 3 independent experiments.

