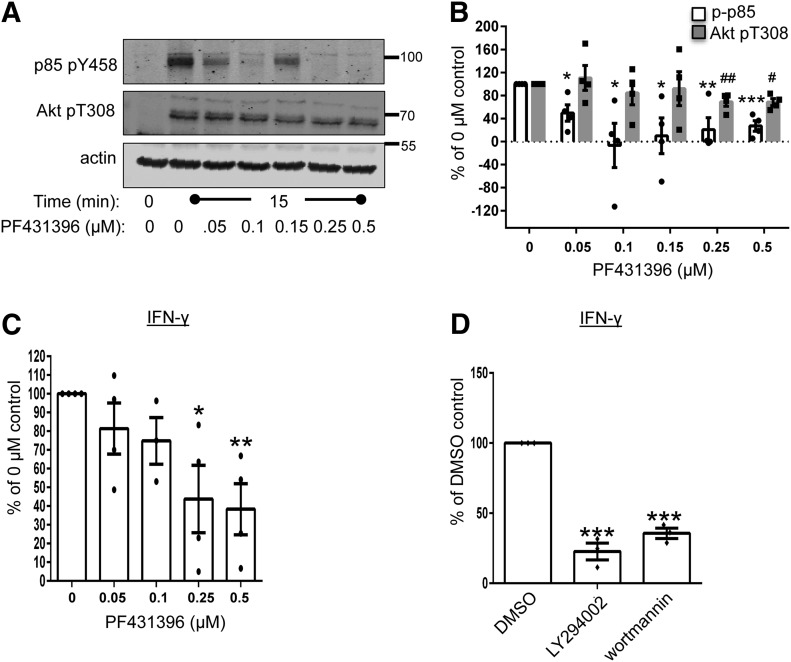
Figure 7. The catalytic activity of Pyk2 controls PI3K function downstream of the TCR.
CD4 hAPBTs were pretreated with various doses of P431396 for 1 h at 37°C. The cells were then stimulated with anti-TCR antibodies for 0 or 15 min. The phosphorylation of p85 Y458 and Akt T308 was detected by immunoblotting. A representative of 4 independent experiments is shown. (B) The immunoblot data from 4 independent experiments were normalized to the 0 μM PF431396 sample. The normalized values for each experiment replicate are shown in the dots, and the mean ± sem is also graphed. (C) CD4 hAPBTs were pretreated with the indicated doses of PF431396 for 1 h at 37°C and then stimulated with immobilized anti-CD3 antibody in the presence of the inhibitor for 24 h. The production of IFN-γ was detected by ELISA. Data were normalized to the 0 μM sample. The dots represent normalized values for individual donor, and the mean ± sem of the 4 independent experiments is also graphed. (D) CD4 hAPBTs were pretreated with the LY294002 or wortmannin for 15 min and stimulated as in C. The data were normalized to the DMSO sample. Each dot represents normalized data from an individual donor, and the mean ± sem from 3 independent experiments was calculated and graphed. *P < 0.05, **P < 0.01, and ***P < 0.001 denote statistical values for p85 Y458 phosphorylation (B) or IFN-γ production (C and D) relative to the control sample; #P < 0.05, and ##P < 0.01 denote statistical values for Akt T308 phosphorylation relative to the control sample.

