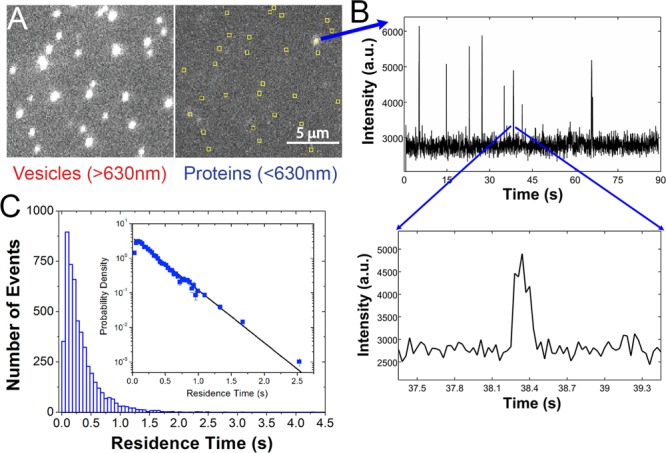
Figure 1.

BtPI-PLC residence times on PC-rich SUVs. (A) A dual-view image showing the vesicle (>630 nm) channel (left) and the protein (<630 nm) channel (right). Yellow squares identify vesicle locations mapped onto the protein channel. (B) Protein fluorescence intensity (arbitrary units, a.u.) vs time for a single SUV. Spikes correspond to single protein landings, and the inset shows the length of a typical landing. (C) The residence time histogram for 5085 landings on 1168 individual SUVs (bars). Inset: koff was determined from the raw residence time data using eq 1, and this fit (line) is superimposed on the probability density.
