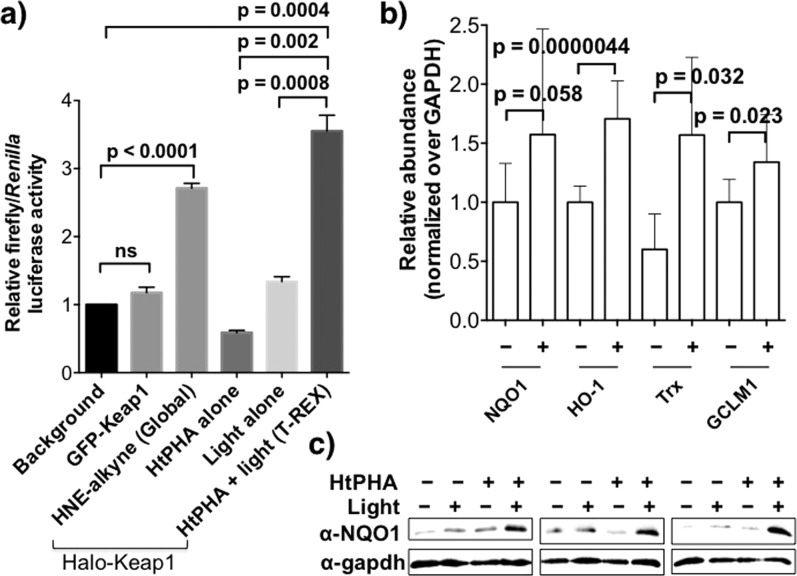
Figure 4.
(a) ARE induction by Keap1-specific HNEylation phenocopies whole-cell HNEylation. Normalized luciferase activity derived from ratio of ARE-inducible firefly to constitutive Renilla luciferase in HEK-293 cells alongside myc-Nrf2 and either Halo-Keap1 or GFP-Keap1 (nontargetable control). (b) mRNA expression of ARE-driven genes induced subsequent to T-REX HNEylation in HEK-293 cells analyzed by qRT-PCR. (c) The expression level of NQO1 assessed by western blot. Also see Figure S9. Error bars in panels a and b designate SD with n = 3 and ≥9, respectively).

