
Figure 2.
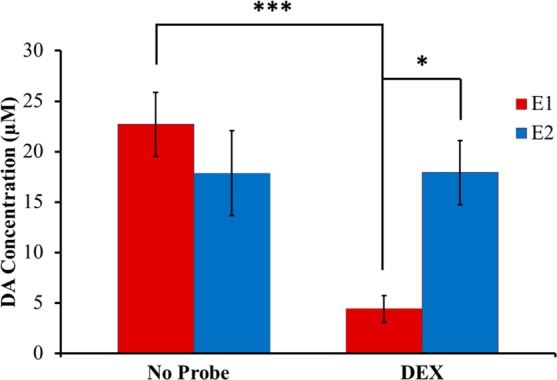
Summary of the amplitude of evoked responses (average ± SEM) at the E1 (red) and E2 (blue) locations without microdialysis probes (n = 5) and 24 h after probes were implanted and perfused with DEX (n = 6). The evoked response at the E1 location after perfusion with aCSF was nondetectable, so the aCSF results were excluded from the statistical analysis. Statistical analysis was performed by two-way ANOVA with location (E1, E2, repeated measure) and probe (no probe, probe with DEX) as the factors. Location is not a significant factor (F(1,9) = 1.99, p > 0.05). Probe is a significant factor (F(1,9) = 9.08, p < 0.05). Interaction between factors is significant (F(1,9) = 8.91, p < 0.05). Post hoc pairwise comparisons with Bonferroni corrections showed that in the presence of DEX the response amplitude at the E1 location is significantly smaller compared to the amplitude at E1 with no probe (***p < 0.0005) and compared to the amplitude at E2 (*p < 0.05). A separate one-sample t test shows that the response amplitude at E1 after 24 h of perfusion with DEX was significantly elevated above zero t(5) = 3.33, p < 0.05 (aCSF group).