
Figure 9.
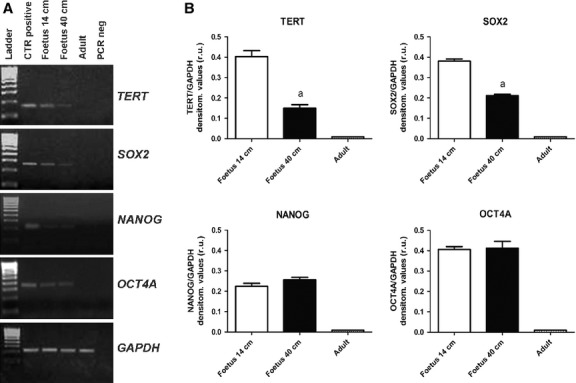
(A) Representative images of TERT, SOX2, NANOG and OCT-4A mRNA stemness-related gene expression profile by RT-PCR in 14-cm fetuses, 40-cm fetuses and adult tendons. (B) The histograms indicate a semi-quantitative analysis of gene expression normalised for GAPDH. Each value was expressed as the mean of three replicates ± SE for each sample. aSignificantly different values between fetuses (P < 0.05); bsignificantly different values of adult samples vs. both types of fetuses (P < 0.05).