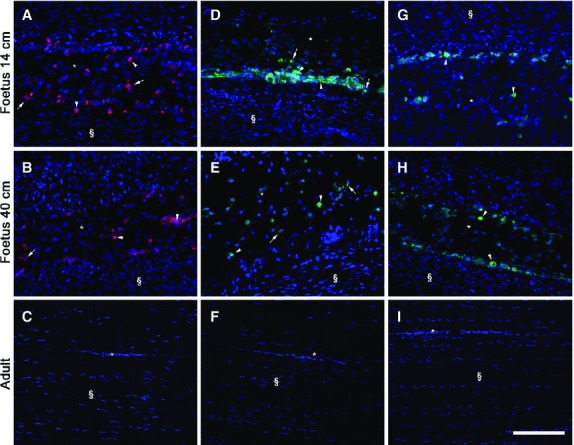
Representative micrographs of immunostaining for TERT, SOX2 and NANOG in mid (A, D and G), late (B, E and H) fetal, and adult tendons (C, F and I). In adult tendons no immunoreactivity to these markers was present. Endotenon (*) and tendon tissue proper (§) are indicated in the images. All these pluripotency stemness markers were always localised within the endotenon (*). On the left images (A, B), TERT localisation (red stain) in the analyzed tendons is shown. The middle images (D, E) show SOX2 distribution (green stain) and, on the right images (G, H), NANOG protein (green stain) expression is also assessed. Examples of nuclei (arrowhead) or cytoplasm (arrow) positive cells are indicated for each marker in the images. Cell nuclei were counterstained with DAPI (blue stain). Scale bar: 50 μm.
