Figure 5.
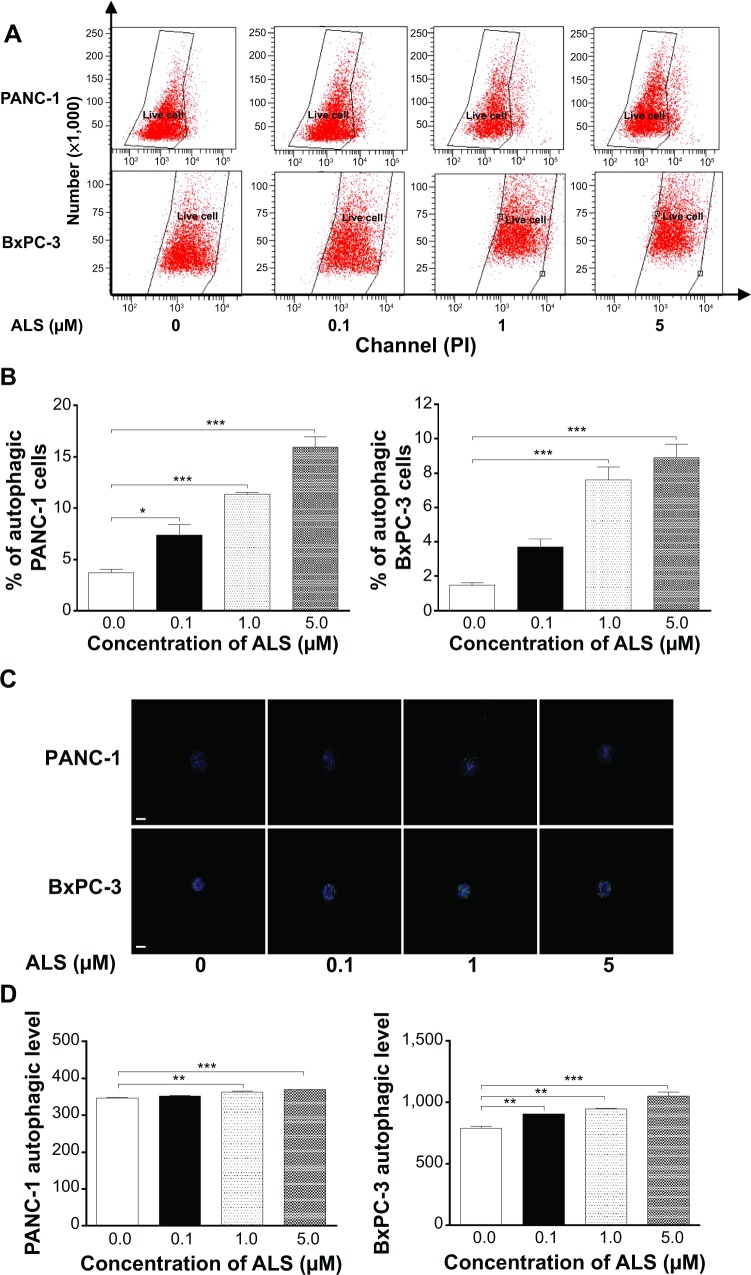
ALS induces autophagic cell death in PANC-1 and BxPC-3 cells.
Notes: Cells were treated with ALS at concentrations of 0.1 μM, 1 μM, and 5 μM for 24 hours and cell samples were subject to flow cytometry analysis and confocal microscopic examination. (A) Flow cytometric plots of PANC-1 and BxPC-3 cells. (B) Bar graphs showing percentage of autophagic cells in PANC-1 and BxPC-3 cells quantified by flow cytometry. (C) Confocal microscopic images showing the autophagy in PANC-1 and BxPC-3 cells. (D) Bar graphs showing the percentage of autophagic PANC-1 and BxPC-3 cells examined by confocal microscopy. Magnification, ×60; scale bar, 5 μM. Data represent the mean ± SD of three independent experiments. *P<0.05, **P<0.01, and ***P<0.001 by one-way ANOVA.
Abbreviations: ALS, alisertib; SD, standard deviation; ANOVA, analysis of variance.

