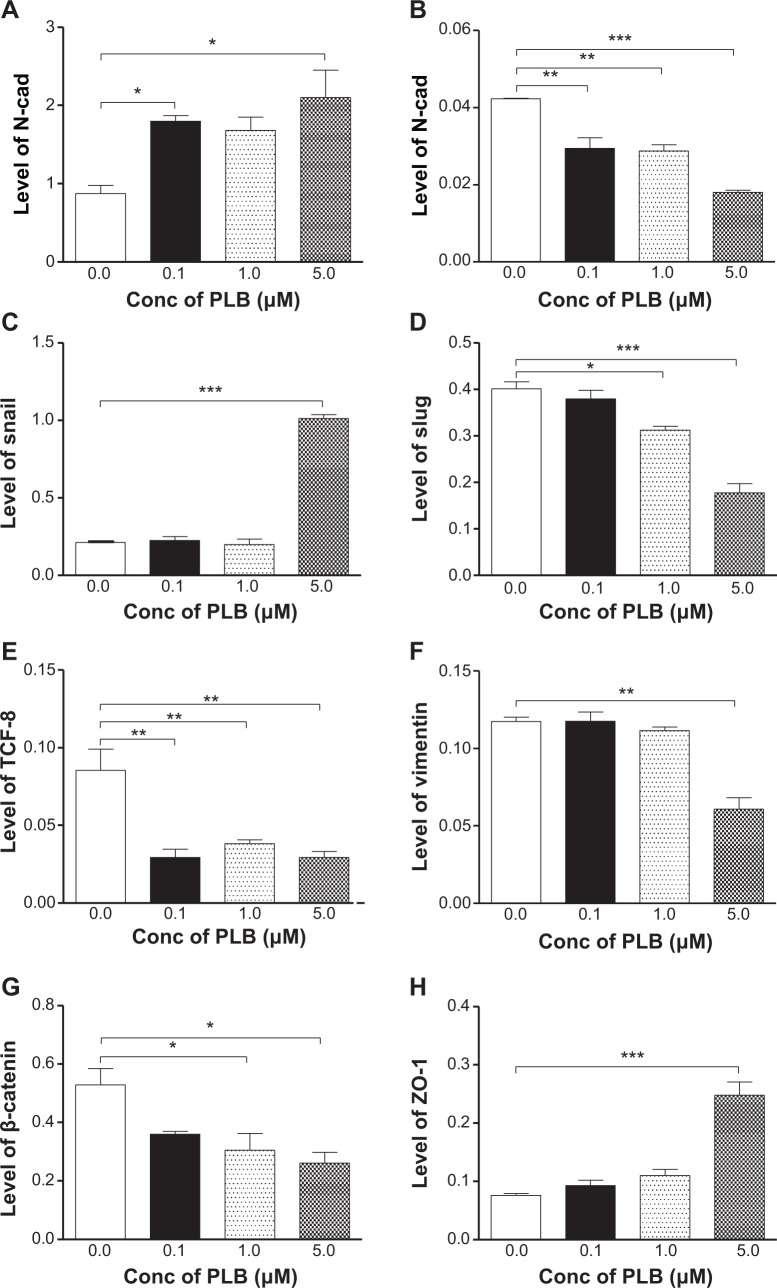
Figure 12.
PLB regulates EMT markers in BxPC-3 cells.
Notes: Cells were treated with 5 μM PLB for 24 hours and then protein samples were subject to Western blotting assay. Bar graphs showing the relative expression level of E-cadherin (A), N-cadherin (B), snail (C), slug (D), TCF-8/ZEB1 (E), vimentin (F), β-catenin (G), and ZO-1 (H) in BxPC-3 cells. Data represent the mean ± SD. *P<0.05, **P<0.01, and ***P<0.001 by one-way ANOVA.
Abbreviations: ANOVA, analysis of variance; Conc, concentration; EMT, epithelial to mesenchymal transition; PLB, plumbagin; SD, standard deviation; TCF-8/ZEB1, zinc finger E-box-binding homeobox 1; ZO-1, zona occludens protein 1.

