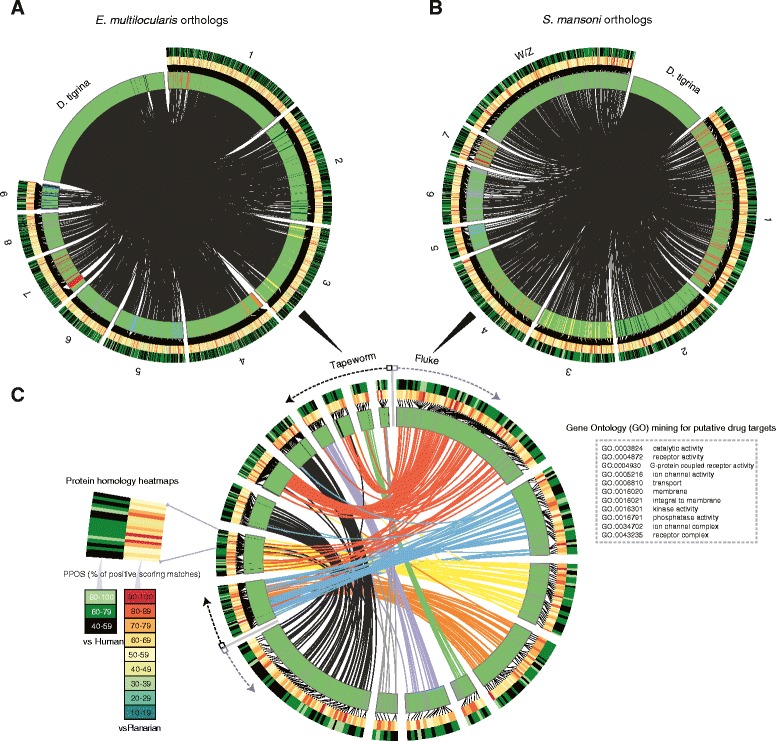
Figure 4.

Mapping of orthology relationships between G. tigrina and the genomes of pathogenic flatworms. A and B) Circos diagram depicting ortholog pairs between arbitrarily arranged G. tigrina transcriptome and the genomes of the tapeworm E. multilocularis and the blood fluke S. mansoni. C) Ideograms are shown for E. multilocularis and S. mansoni chromosomes. Physical ortholog links reveal synteny between these parasites for putative drug targets. Links are shown only where there exists a G. tigrina ortholog. Drug targets were extracted by mining the G. tigrina predicted proteome for GO terms displayed in the box on the right. The inner heat map shows the percent similarity (ppos) between parasite and planarian ortholog protein pairs, and the outer heat map shows similarity between a given parasite protein and its nearest human homolog (RefSeq).
