
Figure 6.
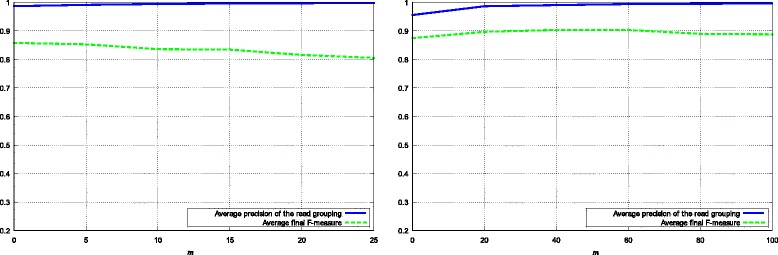
The average precision of the reads grouping in phase 1, and average final F-measure of BiMeta with different values of m - the minimum number of shared q -mers between reads. The left line graph shows tests results on samples from S1 to S5 (short reads). The right line graph shows tests results on samples from R1 to R5 (long reads).