
Figure 1.
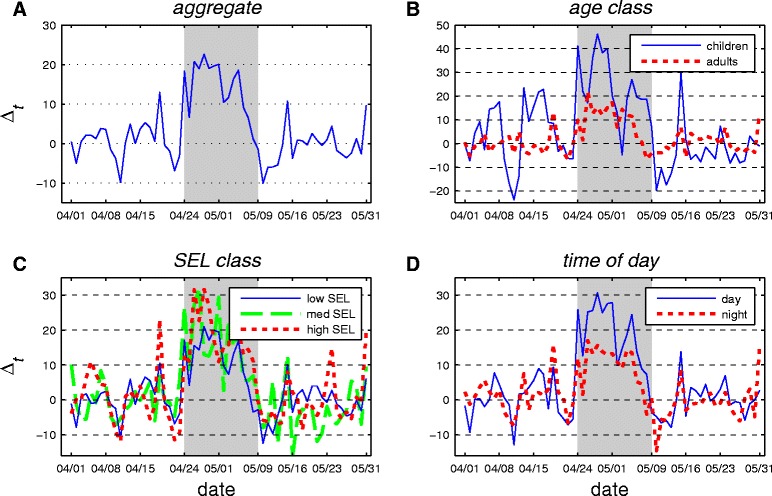
Percentage deviations from mean daily individual average time viewed (Δ t ) for various demographic groups in Mexico City. Panel A shows deviations for the aggregate population. Panel B distinguishes between adults and children. Panel C differentiates by socioeconomic level (SEL). Panel D presents the daytime versus nighttime response. The shaded area in each graph represents the intervention period τ.