
Figure 5. Group level coherograms, and coherence analysis comparing dexmedetomidine baseline to dexmedetomidine-induced unconsciousness.
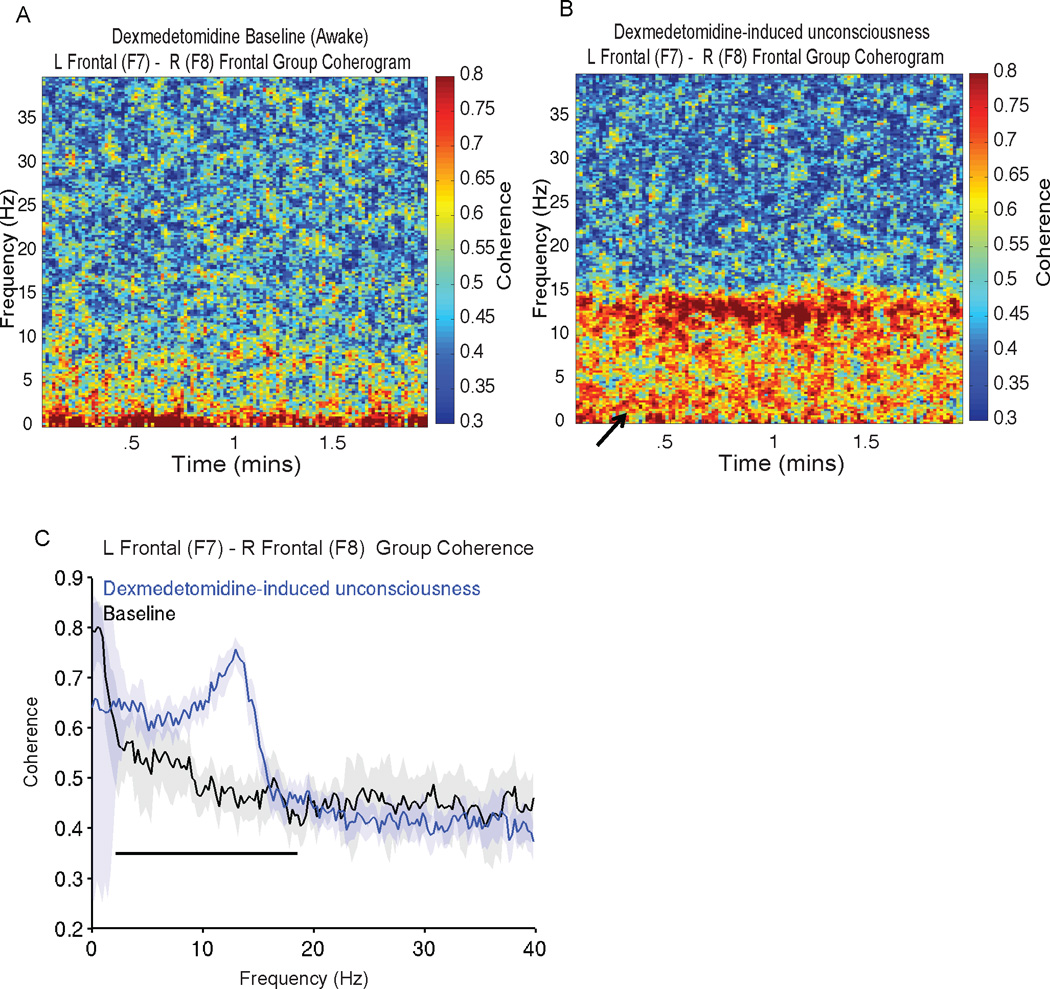
A. Group level coherogram of dexmedetomidine baseline showing relative absence of coherence in the spindle frequency band.
B. Group level coherogram of dexmedetomidine-induced unconsciousness, showing increased coherence in the delta, theta and alpha frequency bands and decreased coherence in the slow wave frequency band (solid arrow).
C. Coherence of dexmedetomidine baseline vs. dexmedetomidine-induced unconsciousness. Coherence was larger during dexmedetomidine-induced unconsciousness at 2.4–18.8 Hz (P < 0.001, TGTC).
Median coherence presented with 95% jackknife confidence intervals. Horizontal solid black line(s) represent frequency ranges at which significant difference existed.
Hz: hertz
TGTC: two group test coherence