
Figure 6. Group level coherograms, and coherence analyses of propofol baseline and propofol-induced unconsciousness (TM and PM).
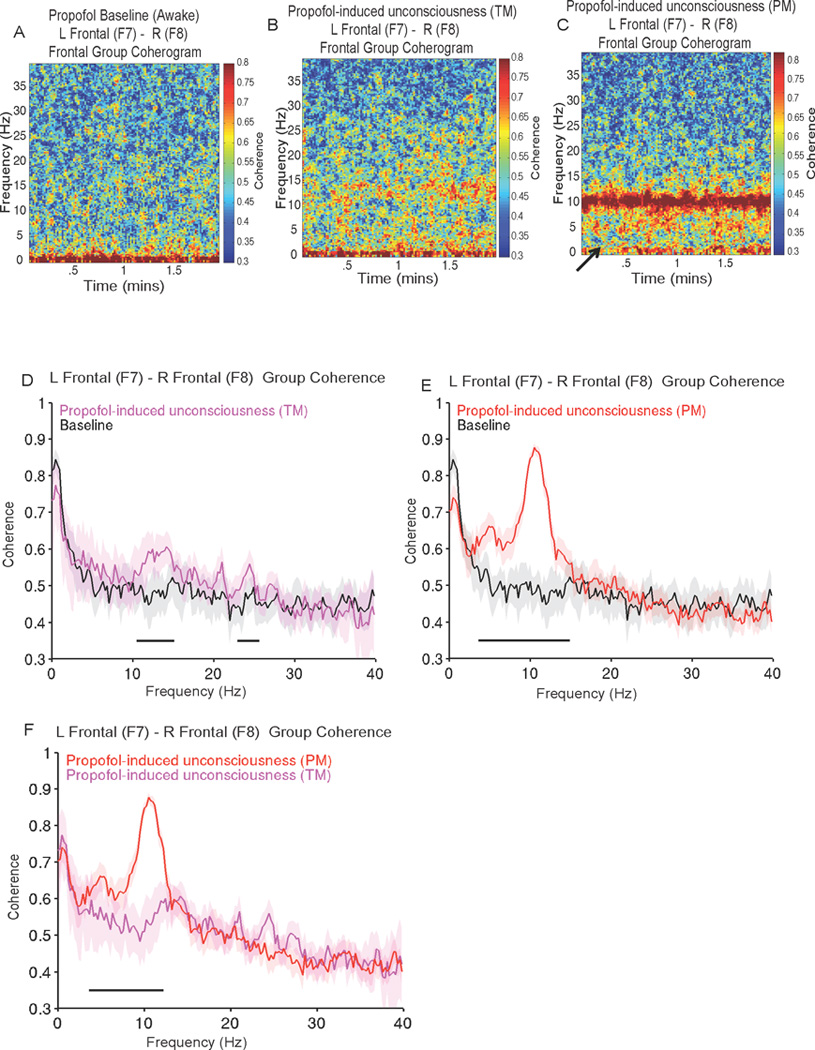
A. Group level coherogram of propofol baseline showing relative absence of coherence in the delta, theta, alpha and beta frequency bands.
B. Group level coherogram of propofol-induced unconsciousness (TM), showing increased coherence in alpha/beta frequency bands.
C. Group level coherogram of propofol-induced unconsciousness (PM), showing increased coherence in slow, delta and alpha frequency bands and a decrease in slow oscillation coherence (solid arrow).
D. Coherence of propofol baseline vs. propofol-induced unconsciousness (TM). Coherence was larger for propofol-induced unconsciousness (TM) in a broad beta/gamma range at 3.9–15.1 Hz, and 17.3–25.9 Hz (P < 0.0003, TGTC).
E. Coherence of propofol baseline vs. propofol-induced unconsciousness (PM). Coherence was larger for propofol-induced unconsciousness (PM) 3.9–15.1 Hz (P < 0.0003, TGTC).
F. Coherence of propofol-induced unconsciousness (TM) vs. propofol-induced unconsciousness (PM). Coherence was larger for propofol-induced unconsciousness (PM) at 3.9–12.5 Hz (P < 0.0003, TGTC).
Median coherence presented with 95% jackknife confidence intervals. Horizontal solid black line(s) represent frequency ranges at which significant difference existed.
Hz: hertz
PM: peak max
TGTC: two group test coherence
TM: trough max