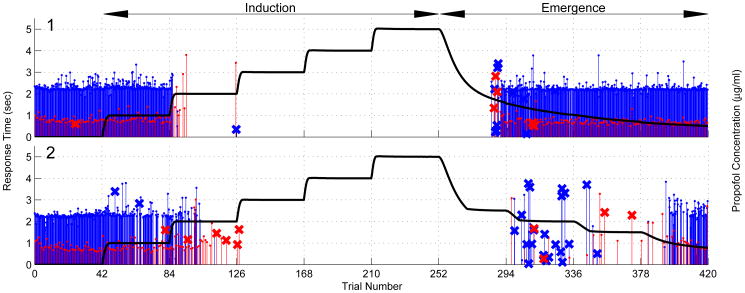
Figure 1.
Target effect-site propofol concentration levels (black) and behavioral responses of verbal (subject's name and neutral words) stimuli (red) and auditory click stimuli (blue) for Subjects 1 (upper panel) and 2 (lower panel). Stimuli were delivered every four seconds. The heights of the vertical lines are the response times in seconds. An X at the tip of the line indicates an incorrect response whereas no X at the tip indicates a correct response. Absence of a vertical line indicates no response. Subject 1 had a low CLOR, as a result, the predicted effect-site concentration did not decrease as fast as the target propofol concentration and did not show a stepwise fashion.

