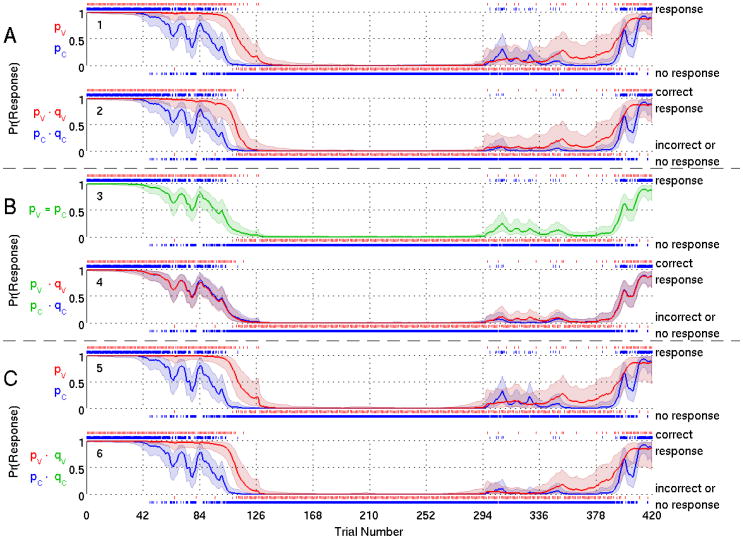
Figure 4.
Model Fit Results for Subject 2 for Model A (panels 1-2), Model B (panels 3-4), Model C (panels 5-6). We show the marginal posterior median estimate of (solid curve) and 95% credible interval (shaded area) of the probability of a response (panels 1, 3 and 5) and probability of a correct response (panels 2, 4 and 6) to verbal stimuli and click stimuli. Response probability curves for verbal stimuli are red and for click stimuli are blue. Green curve (panel 3) indicates response probability curve estimated to be the same for verbal and click stimuli. A vertical dash above (below) the probability curves indicates a response (no response) to an auditory stimulus for panels 1, 3 and 5, or a correct response (an incorrect response or no response) for panels 2, 4 and 6.

