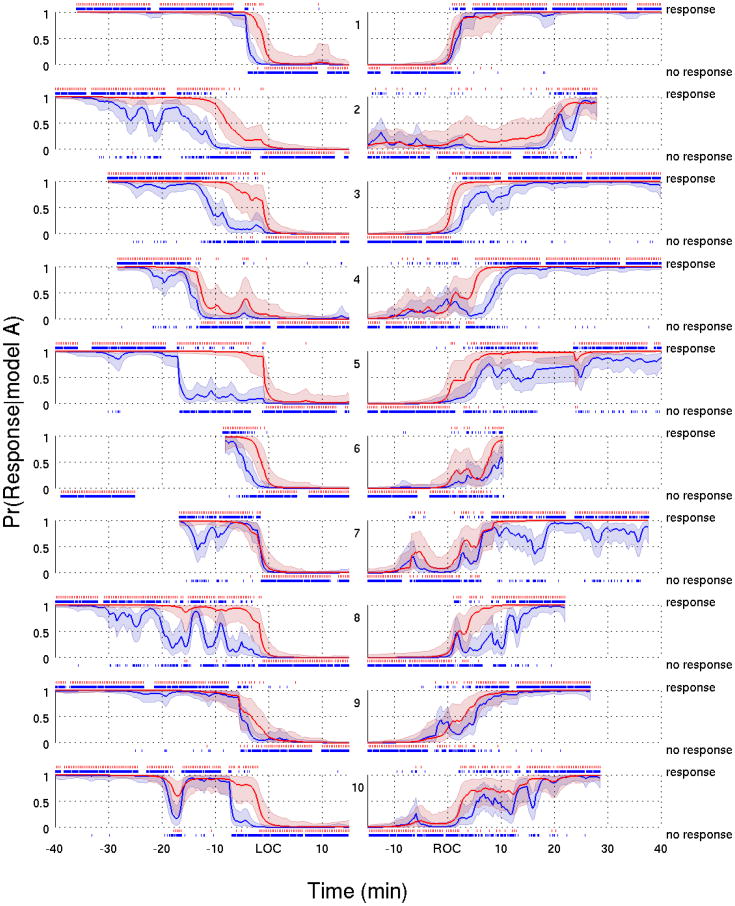
Figure 5.
Response probability curves for the verbal (red) and click (blue) stimuli with their associated 95% credible intervals based on Model A for all ten subjects during the transition into loss of consciousness (left panels) and into recovery of consciousness (right panels). A vertical dash above (below) the probability curves indicates a response (no response) to an auditory stimulus. All probability curves in the left (right) panels were aligned with respect to LOC (ROC).

