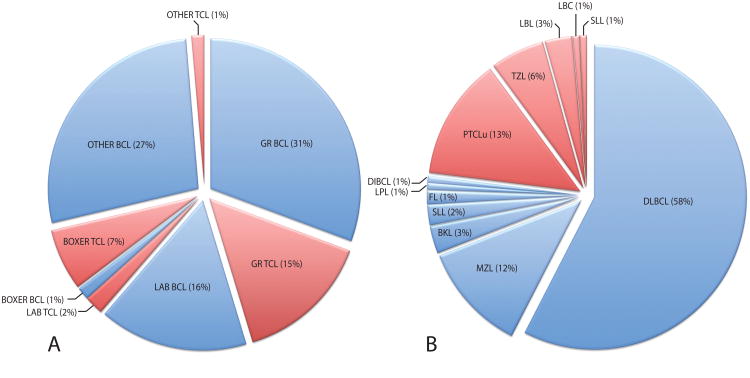
Figure 1.
Distribution of cNHL cases by a) breed and tumor phenotype, and b) by histological subtype. Data for cBCL cases are denoted by blue shading, and for cTCL cases by red shading. A Fisher's exact test identified a highly significant association (p < 0.001) between breed and tumor phenotype. When all cases were stratified according to immunophenotype, the frequency of different histological subtypes showed no significant association with breed (p < 1.00 for BCL, p < 0.768 for TCL).

