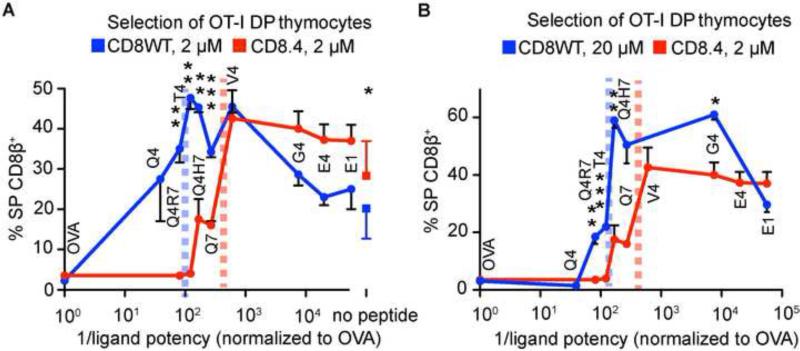
Figure 3. Enhanced Lck coupling lowers the threshold for negative selection.
Fetal thymi from CD8WT and CD8.4 OT-I Rag2−/−β2m−/− mice were exposed to OVA derived APLs at the indicated concentrations Percentage of CD8β+ single positive cells versus 1/potency of the ligands (Daniels et al., 2006) is shown (mean ± SEM, n=2-7). The squares (A) show percentage of single positive cells generated with no peptide (mean ± SD, n = 11-12). The threshold for negative selection is marked by dashed vertical lines. Student's T test (2 tailed, unequal variance): *p<0.05, ** p<0.01, ***<0.001. See also Table S1.

