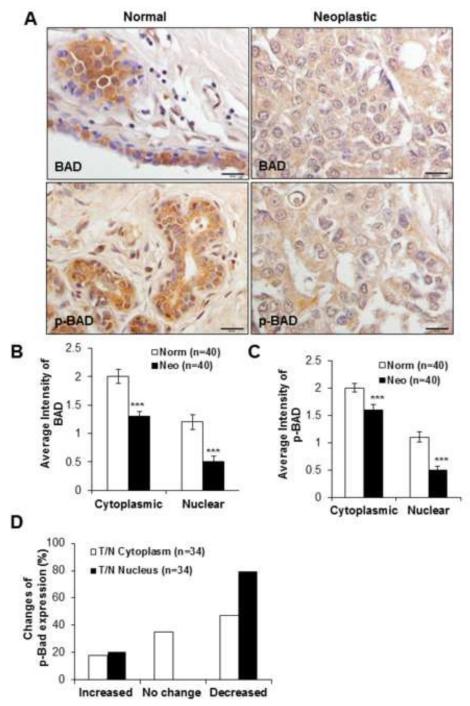
Figure 1. BAD and p-BAD expressions in normal and neoplastic breast tissues by IHC.
(A) Down-regulation of BAD and p-BAD expressions are shown in neoplastic and normal breast tissue. Objective 40X, scale bar 50μm. (B) Semi-quantitative evaluation of IHC staining intensities of BAD and (C) p-BAD in normal and neoplastic breast tissues with the average intensities of cytoplasmic and nuclear expression of BAD and p-BAD. (D) Percentage changes of p-BAD expression in Grade II tumors compared to normal tissue differed between cytoplasm and nucleus (n=34). T=tumor, N=normal; difference significant at ***p<0.001 by Fisher’s exact test. Values represent the mean ± S.D. *p<0.05, ***p<0.001 by Student’s t-test.

