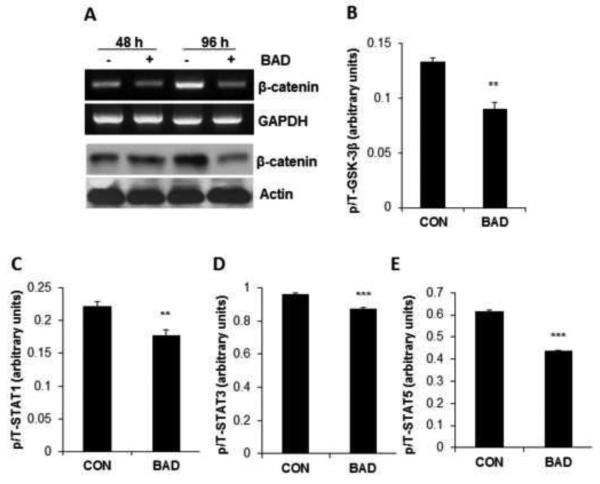
Figure 3. BAD controls expression of β-catenin signaling pathway.
(A) BAD was induced in MCF7 cells for 48 or 96 hrs. β-catenin mRNA was measured by RT-PCR with GAPDH expression measured as control. β-catenin protein was measured by western blot with actin as loading control. (B-E) Phospho and total forms of GSK-3β, STAT1, STAT3 and STAT5 were measured by ELISA. Phospho/total (p/T) ratio of each protein in control vs. BAD-overexpressing cells are shown (n=3). Values represent the mean ± S.E. **p<0.01, ***p<0.001 by Student’s t-test.

