
Fig 5. Regression analysis of perioperative analgesic use after major abdominal surgery.
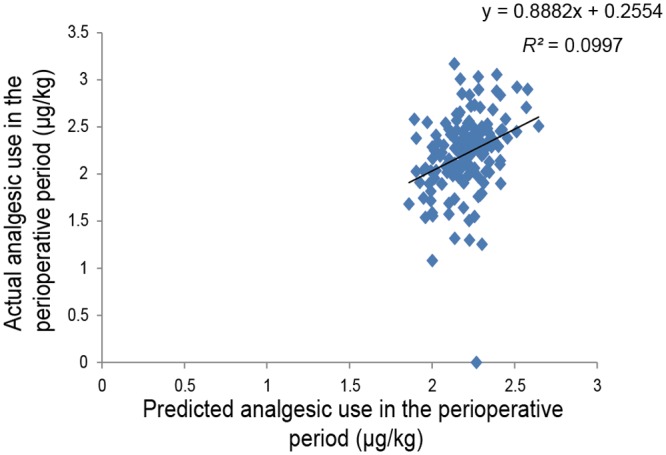
The figure shows a scatterplot for the actual value of perioperative analgesic use (μg/kg; log-transformed) in patients who underwent major abdominal surgery and the predicted value that was calculated. Each point represents an individual patient. The solid line in the scatterplot represents the regression line, and the mathematical formula represents the regression equation.