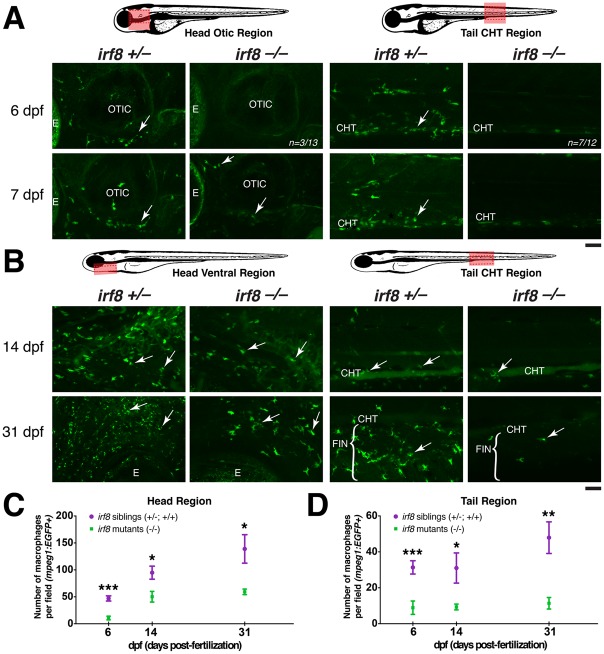
Fig 4. Partial recovery of macrophages in irf8 mutants begins by ~7 dpf in the head region.
Diagrams of zebrafish showing region of quantification (pink box), which was taken using the same magnification and field size of view at all stages. The field of view in older stages covers a relatively smaller region of the head because the fish are larger (comparing B with A). Red dotted box shows the region of the fluorescent images. (A) Expression of macrophage reporter mpeg1:EGFP at 6 and 7 dpf. Arrows show macrophages. At 6 dpf, most irf8 mutants have no macrophages in the CHT (n = 7/12), while most have a few macrophages in the head (n = 10/13); image shows the head region of a mutant at 6 dpf with no macrophages. Panels show the tail CHT region of the irf8 mutants at 6 and 7 dpf with no macrophages; a few autofluorescent pigment cells are present after PTU treatment. (B) Distribution of macrophages expressing mpeg1:EGFP at 14 dpf and 31 dpf. Arrows point to macrophages. (C) Quantification of the number of macrophages per field in the head region over time (pink box in left diagram). (D) Quantification of the number of macrophages per field in the tail region over time (pink box in right diagram). At 6 dpf, n = 20 for siblings and n = 13 for mutants; at 14 dpf, n = 8 for siblings and n = 7 for mutants; at 31 dpf, n = 7 for siblings and n = 5 for mutants. Statistical significance was determined by two-tailed Student’s t-test. Error bars represent S.E.M. ***, p < 0.001; **, p < 0.01; *, p < 0.05; CHT, caudal hematopoietic tissue; E, eye. All scale bars are 50 um. irf8 -/- in this figure represents trans-heterozygous irf8 st95/st96 mutants.

