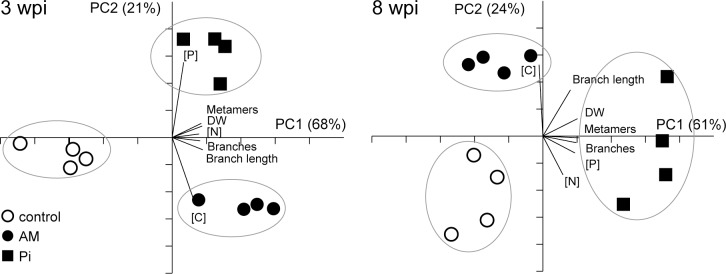
Figure 2. Principal component analysis score plot comparing the nutrient and developmental profile of control, mycorrhized (AM) and phosphate-fertilized plants (Pi).

The P, N and C concentrations ([P], [N] and [C]) of plants at 3 and 8 weeks post inoculation (wpi) were determined and expressed as percentage of shoot dry weight (DW). Each dot represents a single plant. The principal components (PC) explaining most of the variance in the data set are represented on the axis. Biplots indicate how each variable influences the distribution of the data-points. For mycorrhization conditions, see Table 1.
