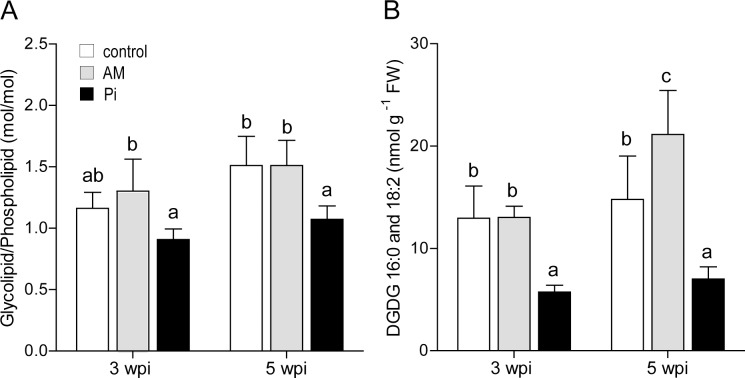
Figure 3. Membrane-lipid content of leaves from control, mycorrhized (AM) and phosphate-fertilized plants (Pi).
(A) Leaves were harvested from plants at 3 and 5 weeks post inoculation (wpi), the membrane lipids were extracted and analyzed by liquid chromatography and mass spectrometry. Molar ratio of glycolipids to phospholipids was calculated based on data for individual lipid species presented in S4 Fig. (B) Content of 16:0- and 18:2 digalactosyldiacylglycerol (DGDG) lipid species is expressed per leaf fresh weight (FW). For mycorrhization conditions, see Table 2 footnote. The data are means of six plants ± SD. Values with different letters are significantly different across treatments according to one-way ANOVA followed by Student-Newman-Keuls test (P<0.05).

