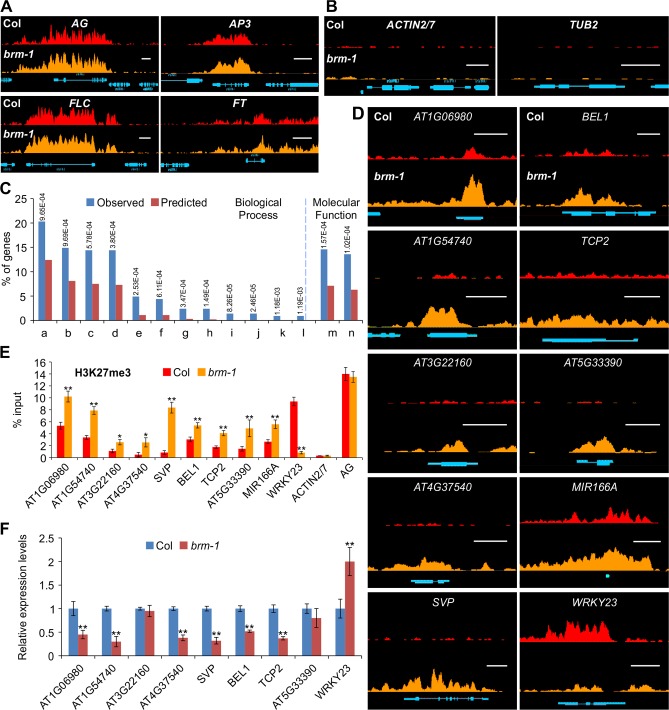
Figure 1. Loss-of-function of BRM results in changes of H3K27me3 distribution over several hundred endogenous genes.
(A) ChIP-seq data for the well-known H3K27me3 target genes AG, AP3, FLC and FT from wild type Col (red; top) and brm-1 (orange; bottom). Gene structures are shown underneath each panel. Scale bars, 1Kb. The plants used were 14-day-old seedlings. (B) ChIP-seq data showing no H3K27me3 signal at two constitutively expressed genes ACTIN2/7 and TUB2 in wild-type Col (red; top) and brm-1 (orange; bottom). Gene structures are shown underneath each panel. Scale bars, 1Kb. (C) Gene Ontology (GO) analysis of the genes showing increased H3K27me3 levels in brm-1. Numbers on the top are P values (hypergeometric test) for GO category enrichment generated by comparing the percentage of the corresponding categories in the genes that showed increased H3K27me3 levels with those in the whole genome. (a) Regulation of biological process;(b) Regulation of metabolic process; (c) Regulation of macromolecule metabolic process;(d) Regulation of gene expression; (e) Response to auxin stimulus; (f) Tissue development; (g) Gene silencing by miRNA; (h) Meristem maintenance; (i) Meristem determinacy; (j) Floral meristem determinacy; (k) Leaf shaping; (l) Maintenance of floral meristem identity; (m) Transcription regulator activity; (n) Transcripiton factor activity. (D) ChIP-seq data showing changes in H3K27me3 levels at 10 selected genes in brm-1. Nine of them showed an increase and one showed a decrease in H3K27me3 levels. Data for the wild-type Col are shown in red at the top, and brm-1 is shown in orange at the bottom. Gene structures are shown underneath each panel. Scale bars, 1Kb. (E) ChIP-qPCR validation using independent samples. Data are shown as percentage of input. ACTIN2/7 and AG were used as control loci that exhibited no change in H3K27me3 deposition. Error bars indicate standard deviations from three biological replicates.*: P < 0.05; **: P < 0.01. (F) Expression analysis of selected genes by qRT-PCR. The expression of each gene was normalized to that of GAPDH, and the expression level in Col was set to 1. Error bars indicate standard deviations from three biological replicates.*: P < 0.05; **: P < 0.01.

